Collaborating GEO-BENE partners: IIASA (leader), RAV, FOR
Background
To inform and improve decision making on disaster risk management and adaptation to climate change on the country, regional and global level, world natural disaster risk maps are needed which incorporate the inherent randomness of the phenomena. Through the use of loss distributions the full information of possible direct and indirect losses can be better assessed and new risk management strategies developed.
Data
The dataset used for this study is gridded data on various scales from various sources, including the ones used in other large scale assessment studies such as the Hotspots studies or UNDP’s Reducing Disaster Risk.
Methods
In a stochastic framework the CatSim and CatView model assesses the financial and economic consequences of natural disasters, showing their impacts on indicators such as national economic growth (in terms of averages and volatility), indebtedness and other important variables. A key concept here is the translation of direct/financial risks (stock effects) into economic/indirect risks (flow effects).
Results
Phase I: While CATSIM assessments have been based on aggregate country-wide assessments of asset risks, a more spatially explicit approach for Geo-Bene was developed, namely the CATVIEW module. The CATVIEW module tries to combine the hazard, elements at risk and the physical sensitivity of the exposure by integrating different estimation techniques (Maximum likelihood estimation as well as Monte Carlo Simulation) to get an overview and approximations of different direct risk levels, e.g. through loss distributions.
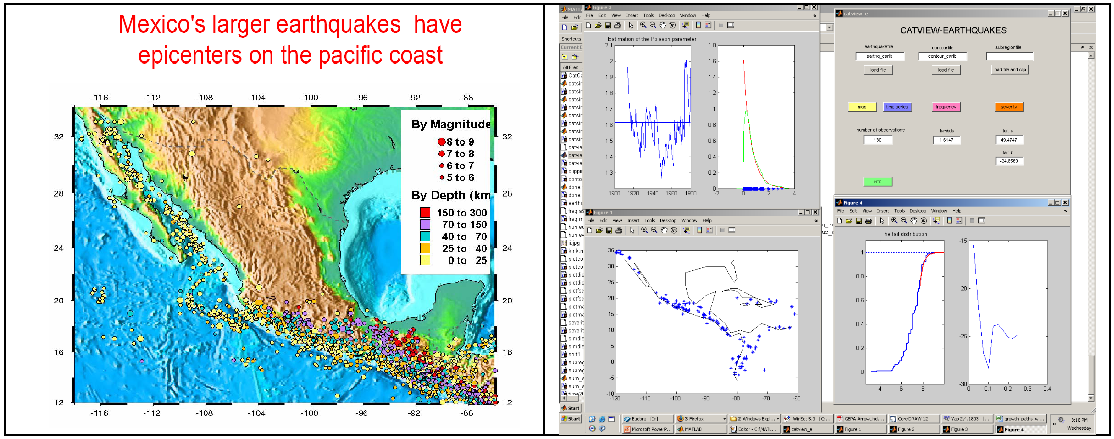
Figure: Left: Earthquake occurrences (intensity and frequency) and (right) loss approximation via the CatView module.
The goal of this approach is to represent natural disaster risk in more detail and more accurately than in existing studies, such as the Hotspots studies or UNDP’s Reducing Disaster Risk. The foreseen output would be probabilistic asset risk maps, which also can be used to assess economic flow effects.
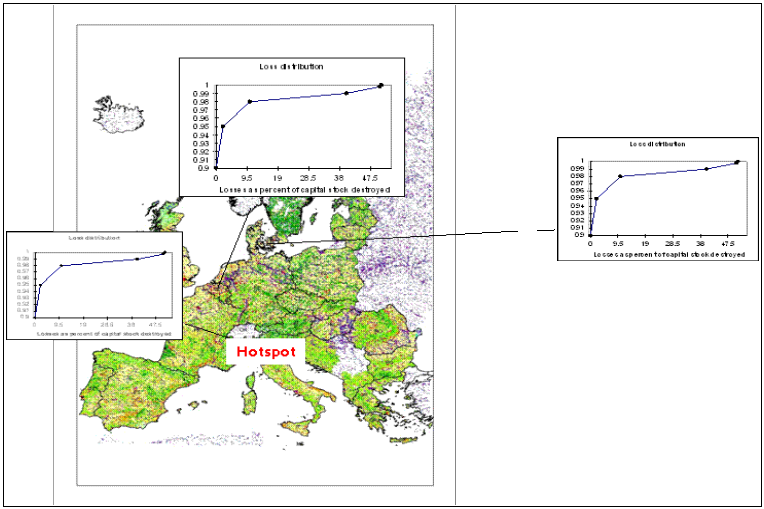
Figure: Foreseen representation of disaster risk for Europe
The CatView output is seen as the basis for the overall process development, which also can be used for scientific assessment of natural extreme events on various scales.
Phase 2:
Due to various problems encountered in phase 1, the ongoing analysis, will focus now at the beginning of phase 2 on hotspots regions and countries with good datasets. While the overall motivation is to provide at the end global risk maps, some methodological challenges have to be tackled first, especially, the lack of data in very important regions of the world, which make it very difficult to use the presented probability based approach for all countries.