Project Title: Global nitrogen flows in cropland Collaborating GEO-BENE partners: Eawag (leader), IIASA, IFPRI, SSCRI
Background
Crop production is by far the single largest cause of human alteration of the global nitrogen cycle, thus raising global sustainability concerns. Previous research on global nitrogen flows in cropland has not made full use of the spatially explicit databases available. Studies generally treat a country or region as a whole, and rarely pay attention to the spatial variations within a country or region. We conduct an assessment in global nitrogen flows in cropland with spatial resolution of 5 arc-minutes for the year 2000. The results are aggregated into national level to analyze nitrogen balance in different countries.Data
This study involves extensive use of spatially explicit databases. We only list the most important ones here. The spatial distributions of harvest area and production of 20 major crops are simulated with a spatial resolution of 5 arc-minutes with a spatial allocation model from IFPRI. The livestock density is from FAO’s Gridded Livestock of the World. Crop-specific fertilizer data are collected from the International Fertilizer Industry Association. Soil parameters are obtained from ISRIC-WISE derived soil properties.Methods
Each of the six nitrogen inputs and five nitrogen outputs is calculated either based on regression models or commonly used methods. The high resolution results are integrated into national averages to assess global nitrogen balance.Results
We calculate a total nitrogen input of 145.3 Tg N yr-1, of which almost half is contributed by mineral nitrogen fertilizer; and a total nitrogen output of 137.2 Tg N yr-1, of which 55% is uptake by harvested crops and crop residues. High resolution maps are provided to quantify the spatial distribution of nitrogen inputs and outputs, soil nitrogen balance, and surface nitrogen balance. The results show almost 80% of African countries were confronted with nitrogen scarcity or nitrogen stress. The calculation also show a global average nitrogen recovery rate of 52%, indicating almost half of the nitrogen input was lost in ecosystems.Status
Manuscript in preparation.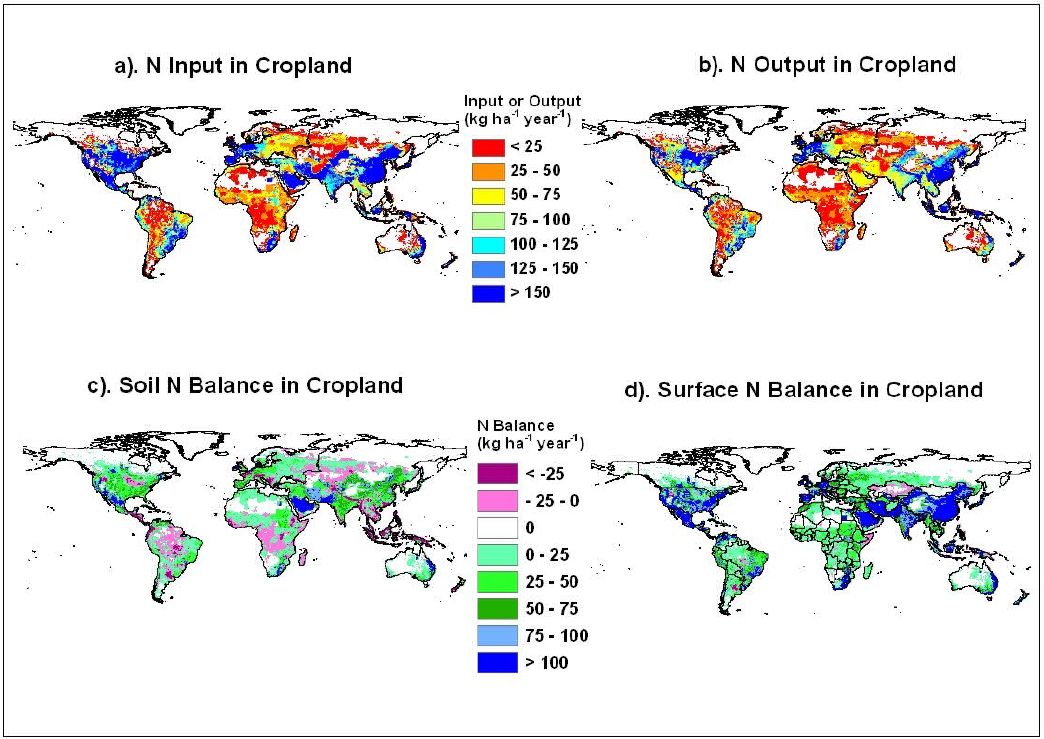 Figure: Maps of global nitrogen input, output, soil nitrogen balance, and surface nitrogen balance