Project title:
Simulation of climate scenarios and sensitivity analysis with the bio-physical process model EPIC
F. Strauss, E. Schmid, H. Formayer, E. Moltchanova
Collaborating GEO-BENE partners: BOKU (lead), UTL, SSCRI, IIASA
Introduction
General circulation models (GCMs) involve strong assumptions on initial conditions with respect to economic growth, global demographics, and the implementation of new technologies. Depending on these assumptions, GCMs may provide various climate scenarios for the next 100 years. Furthermore, the effects of changing emissions on climate are not yet properly understood and cannot be modelled with absolute confidence. For all these reasons, model projections of climate change are described as scenarios rather than predictions. These scenarios differ considerably for the year 2100, but only little in the next 20 to 30 years, because there is an immanent time-lag between changing conditions and climatic impacts, e.g. changes in emission concentration have to accumulate before being detected by GCMs. In this study we present likely scenarios of climate change over the next 20 to 30 years in the agricultural production region Marchfeld (Austria). In contrast to downscaling of the GCM outputs to finer resolutions (e.g. sites, regions) as done in regional climate models (RCMs), we have developed linear regression models to project stochastic climate trends for the next 20 to 30 years. These trends are based on historical in situ weather observations from 1975-2006. In RCMs the spatial resolution is not high enough to show regional variations at small scale. These local variations and effects on regional climate may be better captured with linear regression models, where the variability in the past serves as basis for the future.
There are two aims in this study. First, we have compared the computed stochastic weather trends for the period 2007-2038 with two future climate scenarios from the TYNDALL centre (A1FI and B1) supplied by the University of East Anglia (Mitchell et al., 2004). Second, we have used both climate scenario datasets in the bio-physical process model EPIC (Environmental Policy Integrated Climate, see Williams, 1995) to assess the effects and uncertainties of climate change data on crop yields, soil organic carbon, and nitrate leaching. The resulting comparisons are beneficial in assessing uncertainties of different approaches in developing climate change scenarios and their impacts on bio-physical effects.
Data and Method
The data source for the statistical climate scenarios are daily weather observations between 1975 and 2006 from Grosz Enzersdorf provided by Central Institute for Meteorology and Geodynamics (ZAMG). Two different statistical climate models (model A and model B) have been developed to project weather scenarios for the period 2007-2038. The statistical climate models describe time dependence in terms of linear and seasonal dependencies. Figure 1 shows randomly generated daily residuals for the period 1975-1978, which are added on top of the linear and seasonal time dependencies. For precipitation, our model runs over months rather than days. This reflects the fact that the time scale for precipitation events usually extends over several days.
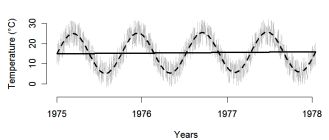
Figure 1.
Illustration of linear dependence (continuous thick line), seasonal dependence (dashed line), and daily variations (continuous thin grey line)
Two different statistical climate models have been developed for estimating the weather parameters precipitation, solar radiation, relative humidity and wind:
Model A: Re-allocation of data from a randomly chosen year in the reference period, and
Model B: Estimation of data by linear regression using linear and seasonal covariates (time dependence as shown in figure 1).
The statistical model B is used for temperature estimations, and is then combined with one of the two different statistical climate models for the other parameters. The particular use of daily (for precipitation monthly) residuals to represent future variations is an integral part of our model. The stochastic feature of our models comes from picking a random year in the past to allocate residuals (respectively observations in model A) from one month. The reallocation procedure has been undertaken 30 times for the period 2007-2038, so that it results in 30 reallocations for each of the two statistical climate models, i.e. 60 scenarios in total.
With EPIC we have assessed the bio-physical impacts of our 60 scenarios on crop yields, soil organic carbon and nitrogen leaching for the period 2007-2038. We validated our results by using two scenarios (A1FI and B1) from the weather input data TYN SC 2.0 for the pixel 48.25°N and 16.25°E (Number of grid: 29945) supplied by the University of East Anglia (TYNDALL data, see Mitchell et al., 2004).
Beside weather data, site-specific data such as soil and crop management have to be included in the EPIC model. A typical soil (Chernozem), crop rotation (corn/winter wheat/sunflower/winter wheat/spring barley), and tillage system (plough, irrigation and no straw removal) were used in the simulations. The atmospheric CO2 concentration was assumed to increase exponentially to 443 ppm in 2038.
Results and discussion
We investigated the daily (for precipitation monthly) residuals of six meteorological parameters and found that these residuals change only marginally between our statistical climate models. The residuals are distributed Gaussian-like, except for precipitation which shows substantial variations. Means and standard deviations of minimum and maximum temperatures in °C differ little between our models (7.3 ± 0.6; 16.1 ± 0.7) and the TYNDALL scenarios (6.9 ± 0.5; 15.1 ± 0.5). There are only minor differences between the A1FI and B1 scenarios for the future period. Mean annual precipitations obtained with the TYNDALL scenarios are slightly higher than the ones obtained with model A and B (555 mm compared to 525 mm, however within errors) while results for solar radiation and relative humidity are very similar between all scenarios (12 MJ/m² and 75%).
The evaluation of the EPIC outputs shows some sensitivity to differences in the weather data of different climate scenarios. Crop yields do not change considerably between the statistical climate models A and B, excepted for corn yields, which are somewhat higher for model A. Using TYNDALL scenarios, we found similar corn yields, sunflower yields and spring barley yields, and somewhat lower winter wheat yields than with our statistical climate models. The differences are due to higher precipitation amounts in winter in our statistical climate models. The variabilites in crop yields are twice as much in our statistical climate models than using TYNDALL scenarios, except for winter wheat where they are similar. Soil organic carbon is almost the same within our statistical climate scenarios and TYNDALL scenarios (around 118 t/ha ± 3 t/ha). Major model-to-model differences are found for nitrate leaching, but the differences are not significant because of the large variations.
References
- T.D. Mitchell, T.R. Carter, P.D. Jones, M. Hulme, and M. New, “A comprehensive set of high-resolution grids of monthly climate for Europe and the globe: the observed record (1901–2000) and 16 scenarios (2001–2100)”, Tyndall Centre, Working Paper 55, Norwich, UK, 2004.
- J.R. Williams, “The EPIC Model”, in: Singh, V.P. (eds.), Computer Models of Watershed Hydrology,Water Resources Publications, Highlands Ranch, Colorado, 909-1000, 1995.
Acknowledgements
This study was supported by the European Commission within the GEO-BENE project framework (Global Earth Observation–Benefit Estimation: Now, Next and Emerging, http://www.geo-bene.eu/).
Status
Published in the proceedings of the ISRSE Conference, 33rd International Symposium on Remote Sensing of Environment - Sustaining the Millennium Development Goals